Everything is connected series #1
How brilliant design connects us – and why we need this now. Here’s a plea. To all of us. Can we start thinking about design as a ‘public service’ not just a way to make things look good
Reporting regulations will continue to get heftier. Regulators and consumers will press for better connected narratives. Good design will continue to help with navigation. We know this. But deep down, we also know that after a decade of regulation creep we are now in danger of over-navigating reporting.
At its heart, a brilliant report works because you don’t notice the navigation – it’s a fantastically easy and simple experience. You understand, you see and you are able to make the decisions you need, when you need. Sounds easy.
Reports are words, data and images – the skill is in deciding how they are allocated, structured and used. This is where great design comes in.
Design is far more connected to strategy than aesthetics. Design is the process of intentionally creating something while simultaneously thinking about its purpose, function and aesthetics.
But in annual reports, design has become overly-associated with delivering a ‘look and feel’ and I think this has led to a decline in the level of communication. As designers, when we encounter a new set of regulations, we have been guilty of creating icons or a colour-coding system to aid navigation. But does this work any more? Did it ever?
I think we need to move the approach on. Designing annual reports in today’s environment is about thinking through the multiple journeys that will be made by different people in many different ways. Design is a truly strategic process that can play a prominent role here. Its value is underestimated. It should be given more prominence in the total reporting process.
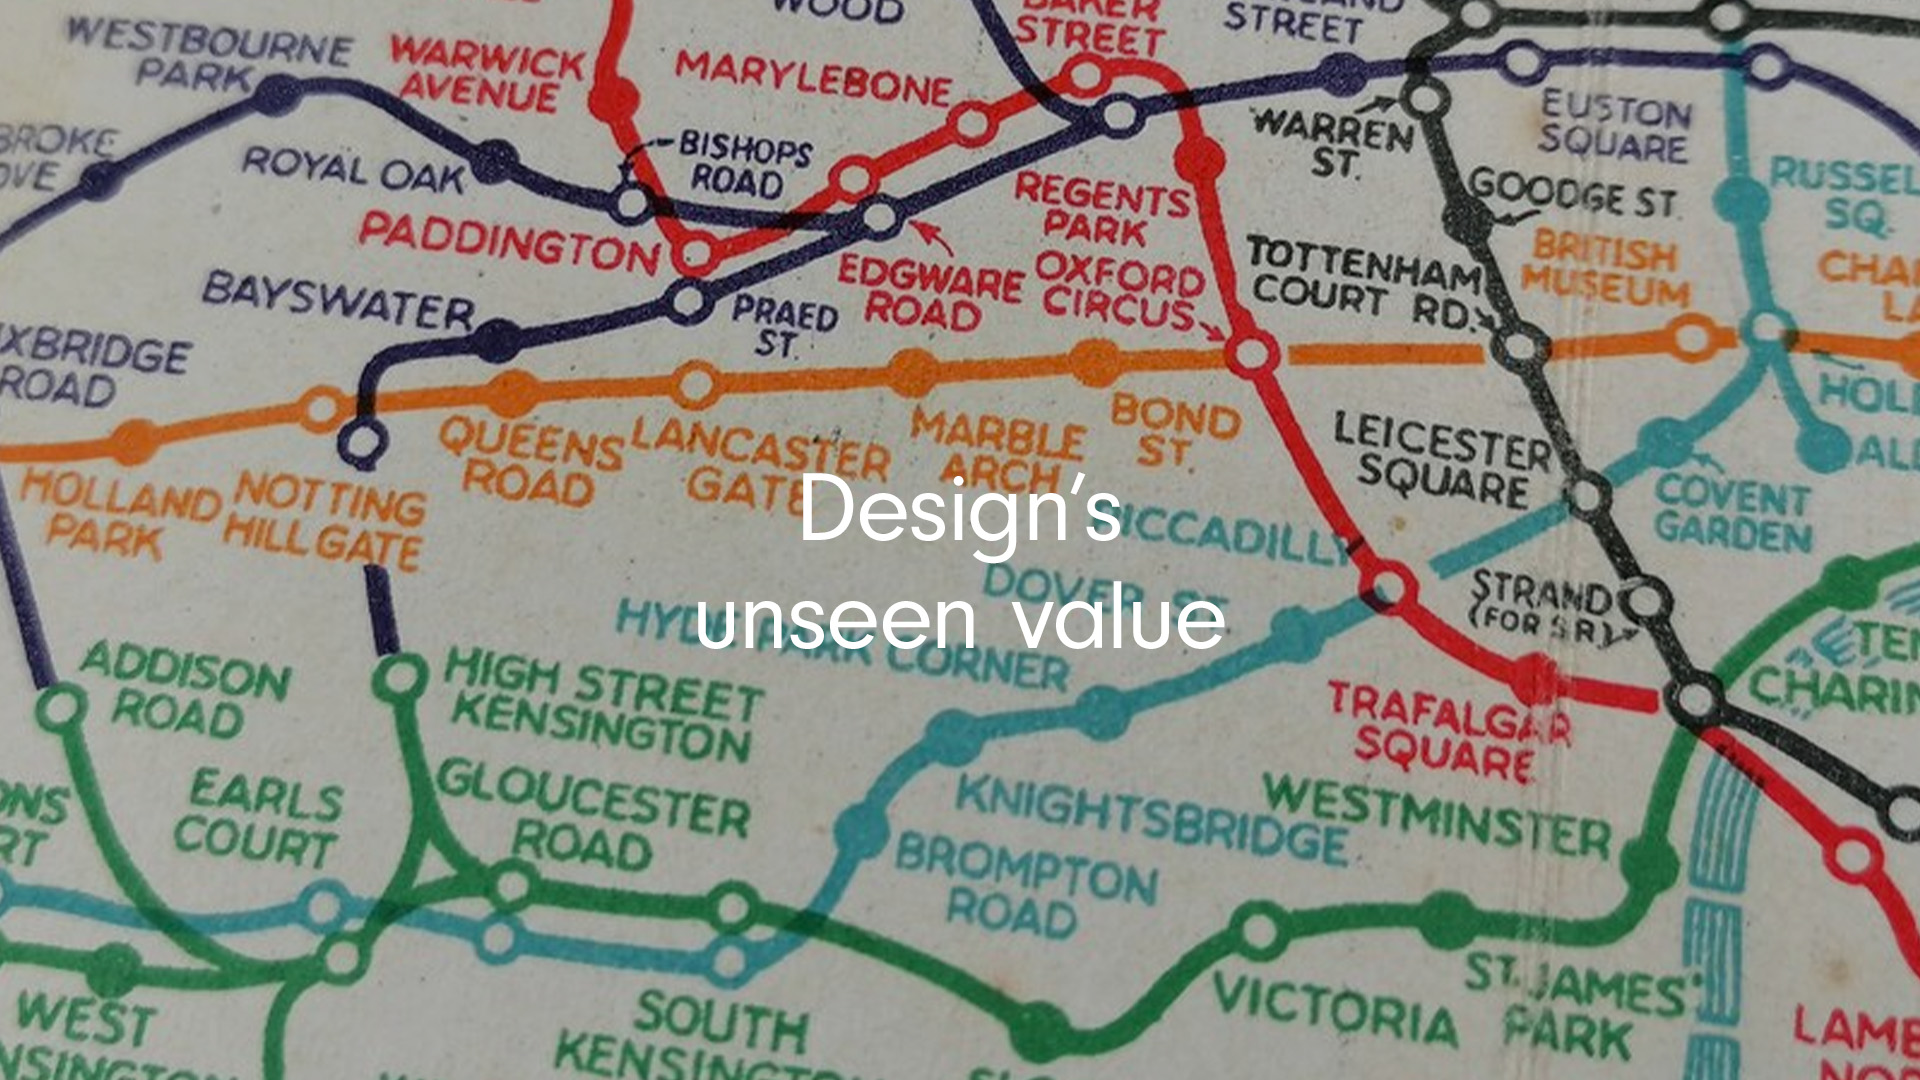
Exploring this track about reporting as a journey, there is an inspiring parallel in how design helped London become the most successful city in the world. It concerns the design of its tube map. Think of the sections we need to navigate in the average annual report and think of the journeys we need to take within London. London’s tube map works intuitively. Very few people get off at Stamford Brook expecting to see Chelsea FC play. But many people don’t or can’t get the often-simple narrative communicated by a company. Which is why the FRC has just published 40 pages on what makes a good annual report and accounts.
Design simplifies and connects. The first London Underground map was a mess because it didn’t use design to achieve its function. Its concept was set at the beginning of understanding its function, not at the end. It was designed to show railway lines in a purist fashion. To faithfully represent where they ran in London. It mistakenly sought to reflect London’s actual geography rather than to achieve its purpose and convey a simple message – this is how you can access and live in London.
Fred Stingemore began the correction process with a simple idea that if all you did was represent something from the perspective of the owner, you would never get user adoption.
He realised that ‘map’ was the wrong concept.
What was needed was a ‘diagram’ showing how easy it was to use London as a liveable city. Under his changes the design became diagrammatic. The distances between stations were regularised and the outer boroughs were brought in to connect to the centre. This was design achieving a social purpose on a grand scale. Before Fred, Plaistow and Richmond had barely any connection. After Fred, selling London’s expansion into Metroland was a doddle.
Aren’t we in the same situation now as London’s map designers were in their early days? We know we need to make the connections, we know that simplicity is best. We know the regulatory environment is expanding. But if we don’t start at the end, we are always going to be tempted by half-baked solutions, graphic tricks, icons and clutter that don’t aid comprehension.
Everything connects in annual reports just as it does in city transport systems. As designers, we have to recognise that people make different journeys, they are always time pressed and they will always use different channels to reach their destination. If we take all of this in when we begin our design process we’ll find simpler solutions that serve the interests of stakeholders and make regulators happy.
And design will have contributed its value to the full.
Want to take your communications further? I’d love to hear from you. Please get in touch with me on my mobile 07973 166 773 alternatively, richard@gather.london